一、prometheus
1、prometheus功能的介绍
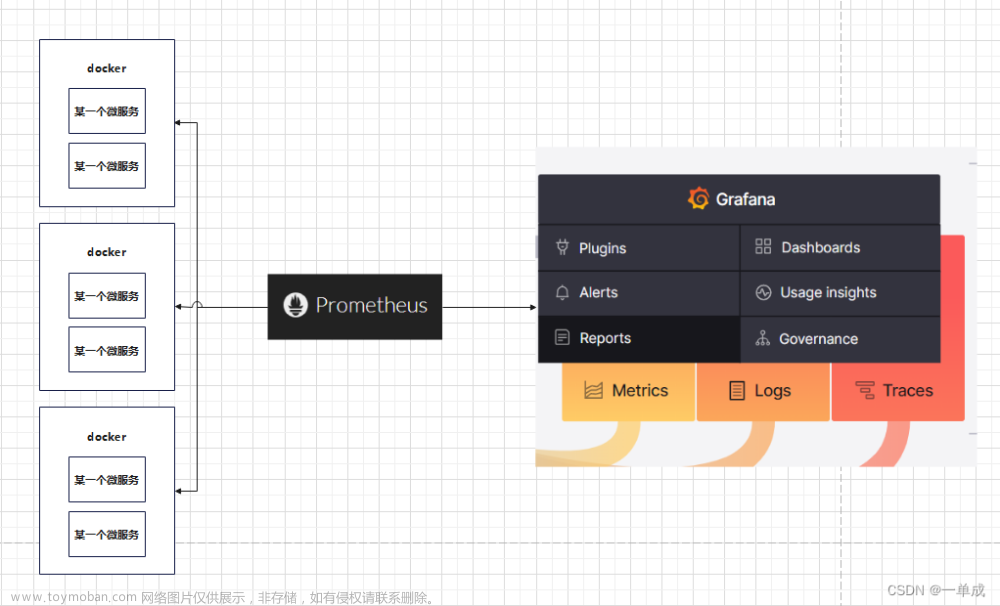
prometheus是一个开源监控解决方案,用于收集 和聚合指标作为时间序列数据。
2、prometheus的下载
网址:https://prometheus.io/download/

二、grafana
1、grafana功能的介绍
Grafana 是一个仪表盘,其主要目的是对各种数据提供可视化。
2、grafana的下载
网址:https://grafana.com/grafana/download
按照红色框框的指引进行下载:


三、windows_exporter
1、windows_exporter功能的介绍
Prometheus客户端分为pull和push两种方式。如果是pull形式的话则是服务端主动向客户端拉取数据,这样需要客户端上安装exporters作为守护进程。
2、windows_exporter的下载
网址:https://github.com/prometheus-community/windows_exporter/releases
四、对windows_exporter的操作
点击红色框框运行:


五、对prometheus进行操作
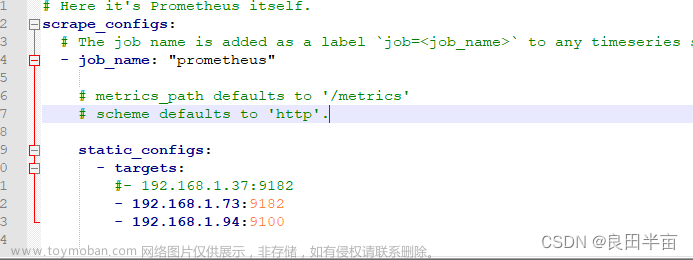
1、找到下载好的prometheus文件夹并打开,对文件 prometheus.yml 进行编辑


 2、运行prometheus
点击红色框框指引的prometheus.exe即可运行:

3、打开网址http://localhost:9090(此处为了验证prometheus监听9182端口是否成功)


六、对grafana进行操作
1、运行grafana
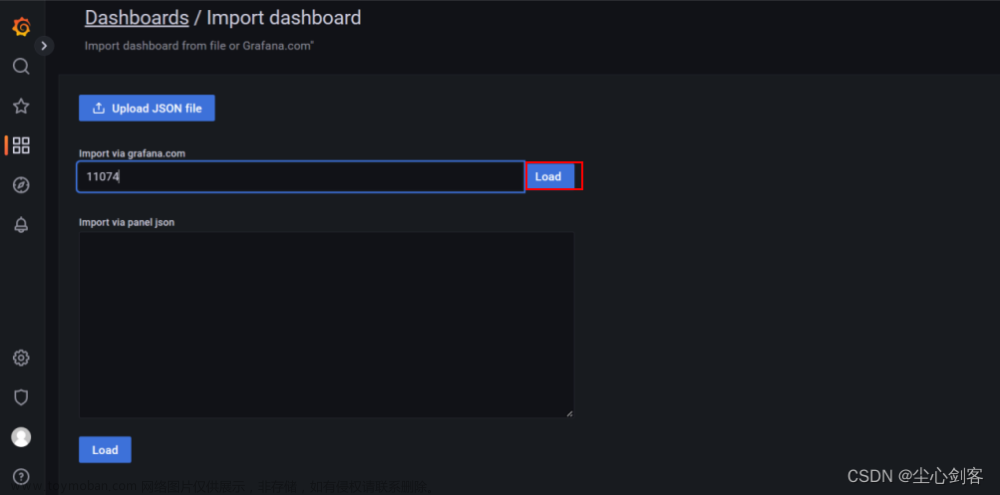
根据红色框框的指引进行操作:


2、打开网址http://localhost:3000(自行注册:建议账号和密码均为admin)


 文章来源:https://www.toymoban.com/news/detail-598092.html
至此,搭建完成。 文章来源地址https://www.toymoban.com/news/detail-598092.html
到了这里,关于云监控系统搭建【prometheus+grafana+windows_exporter】的文章就介绍完了。如果您还想了解更多内容,请在右上角搜索TOY模板网以前的文章或继续浏览下面的相关文章,希望大家以后多多支持TOY模板网!