前言
由于现在echarts的利用率增强,需要用到拓扑图的设计,如果单纯针对echarts文档来看,虽然可以利用API详细了解到功能点,但具体的实际运用与开发场景经验案例还是略有欠缺,下面将针对echarts关系拓扑图进行实例讲解。
一、关系拓扑是什么?
关系拓扑图,顾名思义,是有具体的关系存在的点,具有向量指向特点。那么就要求数据具备source和target的属性。思路是这样的,首先描绘物体(关系点),再者是描绘连接关系点的连线。
二、需求梳理
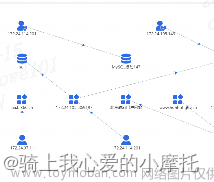
简单效果图如上图,共4层类型,同一层为同一个类型,分别是:运维人员、数据库、应用、用户,连接线为起始到终点的指向关系
三、封装关系图组件
1.父组件引用
index.vue
<relation-graph
	:graph-data="relationGraphData"
	:model="graph.FILE_VIEW_MODEL"
/>
<script>
import graph from '@/configs/graph-setting.js';
export default {
	components: {
		RelationGraph,
	},
	data () {
		return {
			graph,
		   // 关系拓扑图数据
			relationGraphData: {
				dotList: []
			},
		}
	}
}
</script>
2.测试数据引入
测试数据relationGraphData
{
              'relationList': [
                {
                  'originName': 'user_172',
                  'endName': 'application_北京政府门户网站'
                },
                {
                  'originName': 'user_172',
                  'endName': 'application_www.huhhot.gov.cn'
                },
                {
                  'originName': 'user_172',
                  'endName': 'application_172.24.'
                },
                {
                  'originName': 'user_172',
                  'endName': 'application_包头'
                },
                {
                  'originName': 'user_172',
                  'endName': 'application_www.cq.gov.cn'
                },
                {
                  'originName': 'user_172222',
                  'endName': 'application_oa.b.360.cn'
                },
                {
                  'originName': 'user_172.2455',
                  'endName': 'application_9197'
                },
                {
                  'originName': 'application_9197',
                  'endName': 'database_test2'
                },
                {
                  'originName': 'application_9197',
                  'endName': 'database_null'
                },
                {
                  'originName': 'maintenance_172.2455',
                  'endName': 'database_MySQL被动147'
                },
                {
                  'originName': 'maintenance_145',
                  'endName': 'database_test2'
                }
              ],
              'dotList': [
                {
                  'raleName': '172.12',
                  'name': 'user_172',
                  'id': 35641,
                  'type': 'user'
                },
                {
                  'name': 'application_北京政府门户网站',
                  'id': 'www.beijing.gov.cn',
                  'type': 'application'
                },
                {
                  'name': 'application_www.huhhot.gov.cn',
                  'id': 'www.huhhot.gov.cn',
                  'type': 'application'
                },
                {
                  'name': 'application_172.24.',
                  'id': '172.212',
                  'type': 'application'
                },
                {
                  'name': 'application_包头',
                  'id': 'czj.baotou.gov.cn',
                  'type': 'application'
                },
                {
                  'name': 'application_www.cq.gov.cn',
                  'id': 'www.cq.gov.cn',
                  'type': 'application'
                },
                {
                  'raleName': '172222',
                  'name': 'user_172222',
                  'id': 111119,
                  'type': 'user'
                },
                {
                  'name': 'application_oa.b.360.cn',
                  'id': 'oa.b.360.cn',
                  'type': 'application'
                },
                {
                  'raleName': '172.2455',
                  'name': 'user_172.2455',
                  'id': 31472,
                  'type': 'user'
                },
                {
                  'name': 'application_9197',
                  'id': '172.24.105.50:9197',
                  'type': 'application'
                },
                {
                  'name': 'database_test2',
                  'id': 103,
                  'type': 'database'
                },
                {
                  'name': 'database_null',
                  'type': 'database'
                },
                {
                  'name': 'maintenance_172.2455',
                  'type': 'maintenance'
                },
                {
                  'name': 'database_MySQL被动147',
                  'id': 102,
                  'type': 'database'
                },
                {
                  'name': 'maintenance_145',
                  'type': 'maintenance'
                }
              ]
            }
@/configs/graph-setting.js
其中svgPath为关系点的svg地址,此处可见共有四种类型点
export default {
	FILE_VIEW_MODEL: {
		'maintenance': {
			'nodeName': '运维人员',
			'svgPath': 'M604.021298 968.163776v-61.857074a5.877497 5.877497 0 0 0-3.153779-3.010425l-68.092955-35.049953a91.889652 91.889652 0 0 1-51.965677-81.281486v-181.342292a92.033005 92.033005 0 0 1 51.248909-80.779749l18.99435-9.676367c-7.16768-2.437011-14.335359-4.730668-21.503038-6.737619A264.630728 264.630728 0 1 0 324.911857 508.930549a381.320551 381.320551 0 0 0-108.231961 48.811897l-2.293657 1.505213-10.249782 7.16768c-2.150304 1.576889-4.372285 3.153779-6.594265 4.874022l-0.931798 0.645091-5.304083 4.0139c-3.870547 3.010425-7.741094 6.164204-11.970025 9.676368l-4.085577 3.368809-18.56429 15.912249 0.931798 0.501737A397.017769 397.017769 0 0 0 38.204676 889.319302v24.943524a109.80885 109.80885 0 0 0 109.665497 109.737174h467.332705a117.048207 117.048207 0 0 1-11.18158-55.621193z M961.115093 562.114731l-86.012155-44.439613a37.630318 37.630318 0 0 0-16.629016-3.942224 31.609467 31.609467 0 0 0-33.32971 29.602517v89.309286a9.102953 9.102953 0 0 1-5.017376 7.741094l-62.072105 31.896174a11.539964 11.539964 0 0 1-5.160729 1.146829 13.331884 13.331884 0 0 1-2.365334 0 11.539964 11.539964 0 0 1-2.365334-0.860122l-62.000428-32.182881a8.816246 8.816246 0 0 1-5.017376-7.741094V543.693794a26.950475 26.950475 0 0 0-4.443961-14.765419 35.838398 35.838398 0 0 0-45.443089-10.823196l-81.496516 41.572541a52.897475 52.897475 0 0 0-30.032577 46.231533v181.055585a52.969152 52.969152 0 0 0 30.677668 46.446563l68.379663 35.193307a43.006077 43.006077 0 0 1 24.37011 37.701994V967.662039c0.501738 45.944826 11.468287 54.832748 63.07558 54.832748h93.179834c51.750646 0 63.218933-16.700693 64.079055-55.334486v-61.140306a43.006077 43.006077 0 0 1 24.083404-37.988702l72.823624-37.55864a44.654643 44.654643 0 0 0 25.373585-38.992177V601.393615a44.582967 44.582967 0 0 0-24.656817-39.278884z m-147.869229 243.701104H693.760646c-16.342309 0-30.749345-11.18158-31.107729-25.875323a28.097304 28.097304 0 0 1 29.74587-27.308859h119.413541c16.485663 0 30.749345 11.324934 31.179406 25.875323a28.168981 28.168981 0 0 1-29.74587 27.523889z',
			'zIndex': 3
		},
		'database': {
			'nodeName': '数据库',
			'svgPath': 'M858.2 766.3V616.7c-22.1 19.3-47 35.2-73.7 47.2-86.5 38-180 57.2-274.5 56.3-122 7.1-242.8-27-343.1-96.7v150.7C173.7 840 318.8 912 512.3 912c193.5 0 337.5-72.6 345.9-138.9v-6.8z M858.2 507v-2.8 6.8c-8.4 66.4-152.4 138.9-345.9 138.9-193.5 0-338.6-72-345.4-137.8V361.3C267.2 431.1 388 465.1 510 458c94.5 0.9 188-18.2 274.5-56.3 26.7-12.1 51.6-28 73.7-47.2V507z M762.6 160.5c57.4 25.3 91.7 61.3 91.7 93.4 0 31.5-35.4 66.4-91.7 93.4-80 34-166.2 50.7-253.1 48.9-196.9 0-343.7-74.8-343.7-141.7s147.4-142.3 344.8-142.3c86.5-1.9 172.3 14.6 252 48.3z',
			'zIndex': 2
		},
		'application': {
			'nodeName': '应用',
			'svgPath': 'M358.4 141.1c16.2 0 30.1 5.6 41.7 16.8 11.6 11.2 17.3 24.9 17.3 41.2l0 233.8c0 16.2-5.7 30.1-17.3 41.7-11.6 11.6-25.4 17.3-41.7 17.3L124.6 491.9c-16.2 0-29.9-5.7-41.2-17.3-11.2-11.6-16.8-25.4-16.8-41.7L66.6 199.1c0-16.2 5.6-29.9 16.8-41.2 11.2-11.2 24.9-16.8 41.2-16.8L358.4 141.1 358.4 141.1zM358.4 608.7c16.2 0 30.1 5.6 41.7 16.8 11.6 11.2 17.3 24.9 17.3 41.2l0 234.8c0 16.2-5.7 29.9-17.3 41.2-11.6 11.2-25.4 16.8-41.7 16.8L124.6 959.5c-16.2 0-29.9-5.6-41.2-16.8s-16.8-24.9-16.8-41.2L66.6 666.7c0-16.2 5.6-29.9 16.8-41.2 11.2-11.3 24.9-16.8 41.2-16.8L358.4 608.7zM826.9 608.7c16.2 0 29.9 5.6 41.2 16.8 11.2 11.2 16.8 24.9 16.8 41.2l0 234.8c0 16.2-5.6 29.9-16.8 41.2-11.2 11.2-24.9 16.8-41.2 16.8L593.2 959.5c-16.2 0-30.1-5.6-41.7-16.8-11.6-11.2-17.3-24.9-17.3-41.2L534.2 666.7c0-16.2 5.7-29.9 17.3-41.2 11.6-11.2 25.4-16.8 41.7-16.8L826.9 608.7zM943.1 243.9c12.5 12.5 18.7 27.1 18.7 43.9 0 16.8-6.2 31.2-18.7 43.1l-174 174c-12.5 12.5-26.9 18.7-43.4 18.7s-31-6.2-43.4-18.7l-174-174c-11.9-11.9-17.8-26.2-17.8-43.1 0-16.8 5.9-31.5 17.8-43.9l173.9-173.9c12.5-11.9 26.9-17.8 43.4-17.8s31 5.9 43.4 17.8L943.1 243.9z',
			'zIndex': 1
		},
		'user': {
			'nodeName': '用户',
			'svgPath': 'M815.814506 299.350645c0 165.306834-134.011812 299.350645-299.350645 299.350645s-299.350645-134.011812-299.350645-299.350645c0-165.306834 134.011812-299.350645 299.350645-299.350645s299.350645 134.011812 299.350645 299.350645z M763.52814 612.780851c-69.75782 55.070279-156.219118 85.661323-247.064279 85.661323-91.901128 0-179.1944-31.295022-249.27221-87.421268-184.698228 67.805881-267.19165 304.758476-267.19165 412.979094l1027.711884 0c0-107.260648-83.133402-342.549295-264.183744-411.18715z',
			'zIndex': 0
		}
	}
}
3.封装关系子组件
代码如下(示例):
<template>
  <div class="graph-container">
    <div
      id="echartGraph"
      ref="graph_ref"
      class="graph-chart"
    />
    <div v-show="!hasData" class="noData">
      暂无数据
    </div>
  </div>
</template>
首先针对数据做去重处理,根据数据计算出关系点的坐标,这里的纵坐标间隔是yAxisSpace 320
横向排序坐标是通过去重后数据,按照需要排序的顺序['maintenance', 'database', 'application', 'user']进行排列,通过ZIndex字段0,1,2,3也可以表明层次关系
// 数组根据字段去重
	dotList =  this.deWeight(graphData.dotList, 'name');
	let yAxisLength = (this.deWeight(dotList, 'type')).length;
	let yAxisSpace = parseInt(320);//取间隔距离,默认yAxis max为1000像素
	let xAxisLengthObject = this.getRepeatNum(dotList);//获取节点重复个数
	dotList.sort(function(a, b) {
		// order是规则 list是需要排序的数组
		var order = ['maintenance', 'database', 'application', 'user'];
		return order.indexOf(a.type) - order.indexOf(b.type);
	});
下面就是一套计算坐标的逻辑,让节点数据按照固定顺序匹配遍历,每层重复个数即为要展示的同类型节点。
若是需要关系扩展,相应的增加关系数据
	let maxXlength = this.maxLength;

	// 循环动态计算xy横纵轴坐标
	for (let i = 0, k = 0;i < dotList.length;i++, k++) {
		let objectLength = xAxisLengthObject[dotList[i].type];
		if (k < objectLength) {
			dotList[i].x = (parseInt(maxXlength / (objectLength + 1))) * k + 10;
		} else {
			k = 0;
			dotList[i].x = (parseInt(maxXlength / (objectLength + 1))) * k + 10;
		}
		if (this.XMaxData < dotList[i].x) {
			this.XMaxData = dotList[i].x;
		}

		let yData = yAxisSpace * (this.model[dotList[i].type].zIndex);
		// 分类相同的y轴相同
		// 对于y坐标值大于900的情况的特殊处理
		if (yData > 900) {
			dotList[i].y = 900;
			if (i !== 0 && dotList[i].type === dotList[i - 1].type) {
				dotList[i].y = dotList[i - 1].y;
			} else {
				//下面如果有数据依次递减300或者等于0
				if (i !== 0 && yData > dotList[i - 1].y && yAxisLength === 2) {
					dotList[i].y = 10;
				} else if (i !== 0 && yData > dotList[i - 1].y) {
					dotList[i].y = dotList[i].y - 300 === 0 ? 10 : dotList[i].y - 300;
				}
			}
		} else {
			dotList[i].y = yAxisSpace * (this.model[dotList[i].type].zIndex);
		}

		dotList[i].svgPath = this.model[dotList[i].type].svgPath;
		dotList[i].symbolSize = this.model[dotList[i].type].symbolSize ? this.model[dotList[i].type].symbolSize : '';
	}
当name名值对不上,即是默认归为原点位置,连线的数据通过类型lines的data数据传入,节点的数据通过类型为graph的2d效果绘制文章来源:https://www.toymoban.com/news/detail-648056.html
4.关系组件完整代码
<script>
import * as echarts from 'echarts';
export default {
  props: {
    graphData: {
      type: Array,
      required: true
    },
    model: {
      type: Object,
      required: true
    }
  },
  data () {
    return {
      chartInstance: null,
      hasData: false,
      XMaxData: 0, //x轴最大坐标轴
      maxXlength:1200
    };
  },
  watch: {
    graphData: {
      deep: true,
      immediate: true,
      handler() {
        this.$nextTick(() => {
          this.initDotInfo();
        });
      }
    }
  },
  mounted() {
    // 获取关系图数据
    this.$nextTick(() => {
      this.initDotInfo();
    });
    window.addEventListener('resize', this.initDotInfo);
  },
  destroyed () {
    // 组件销毁时,清空resize,避免内存泄漏
    window.removeEventListener('resize', this.initDotInfo);
  },
  methods: {
    initDotInfo() {
      this.XMaxData = 0;
      let dotList =  [];
      this.hasData = false;
      let graphData = JSON.parse(JSON.stringify(this.graphData));
      if (graphData) {
        // 空值判断
        if (JSON.stringify(graphData.dotList) != '[]') {
          this.hasData = true;
        }
        // 数组根据字段去重
        dotList =  this.deWeight(graphData.dotList, 'name');
        let yAxisSpace = parseInt(320);//取间隔距离,默认yAxis max为1000像素
        let xAxisLengthObject = this.getRepeatNum(dotList);//获取节点重复个数
        dotList.sort(function(a, b) {
          // order是规则 list是需要排序的数组
          var order = ['maintenance', 'database', 'application', 'user'];
          return order.indexOf(a.type) - order.indexOf(b.type);
        });
        let maxXlength = this.maxLength;

        // 循环动态计算xy横纵轴坐标
        for (let i = 0, k = 0;i < dotList.length;i++, k++) {
          let objectLength = xAxisLengthObject[dotList[i].type];
          if (k < objectLength) {
            dotList[i].x = (parseInt(maxXlength / (objectLength + 1))) * k + 10;
          } else {
            k = 0;
            dotList[i].x = (parseInt(maxXlength / (objectLength + 1))) * k + 10;
          }
          if (this.XMaxData < dotList[i].x) {
            this.XMaxData = dotList[i].x;
          }

          let yData = yAxisSpace * (this.model[dotList[i].type].zIndex);
          // 分类相同的y轴相同
          // 对于y坐标值大于900的情况的特殊处理
          if (yData > 900) {
            dotList[i].y = 900;
            if (i !== 0 && dotList[i].type === dotList[i - 1].type) {
              dotList[i].y = dotList[i - 1].y;
            } else {
              //下面如果有数据依次递减300或者等于0
              if (i !== 0 && yData > dotList[i - 1].y && yAxisLength === 2) {
                dotList[i].y = 10;
              } else if (i !== 0 && yData > dotList[i - 1].y) {
                dotList[i].y = dotList[i].y - 300 === 0 ? 10 : dotList[i].y - 300;
              }
            }
          } else {
            dotList[i].y = yAxisSpace * (this.model[dotList[i].type].zIndex);
          }

          dotList[i].svgPath = this.model[dotList[i].type].svgPath;
          dotList[i].symbolSize = this.model[dotList[i].type].symbolSize ? this.model[dotList[i].type].symbolSize : '';
        }
        // 加载关系连线图数据
        this.initRelationDot(dotList, graphData);
      }
    },

    // 获取关系拓扑图节点数据
    initRelationDot(list, graphData) {
      let relationDotList = this.deWeight(graphData.relationList, 'originName', 'endName');
      let linesDataNodes = [];
      relationDotList.forEach((item)=>{
        let node = [];
        list.find((items, indexs)=>{
          if (item.originName === items.name) {
            node.push([items.x, items.y]);
            return true;
          }
          if (item.originName != items.name && indexs == (list.length - 1)) {
            node.push([0, 0]);
            return true;
          }

        });
        list.find((items, indexs)=>{
          if (item.endName === items.name) {
            node.push([items.x, items.y]);
            return true;
          }
          // 当不匹配点,随机分配到原点
          if (item.endName != items.name && indexs == (list.length - 1)) {
            node.push([0, 0]);
            return true;
          }
        });
        linesDataNodes.push({coords: node});

      });
      this.initChart(list, linesDataNodes);
    },

    // 初始化图表内容
    initChart(nodes, linesDataNodes) {
      let that = this;
      this.chartInstance = echarts.init(this.$refs.graph_ref);
      var charts = {
        nodes: [],
        linesData: linesDataNodes
      };
      for (var j = 0; j < nodes.length; j++) {
        const {
          id,
          name,
          svgPath,
          symbolSize,
          type,
          x,
          y,
        } = nodes[j];
        var node = {
          ids: id,
          name,
          type,
          value: [x, y],
          symbolSize: symbolSize || 30,
          symbol: 'path://' + svgPath,
          itemStyle: {
            color: '#2E6BE6',
          }
        };
        charts.nodes.push(node);
      }
      const initOption = {
        //设置echarts图随滚轮缩放
        dataZoom: [
          {
            type: 'inside'
          }
        ],
        grid: {
          x: 80,
          y: 0,
          x2: 80,
          y2: 100
        },
        backgroundColor: '#fff',
        xAxis: {
          min: 0,
          max: this.XMaxData < 1000 ? 1000 : this.XMaxData,
          show: false,
          type: 'value'
        },
        yAxis: {
          min: 0,
          max: 1000,
          show: false,
          type: 'value'
        },
        tooltip: {
          show: true,
          enterable: true,
          triggerOn: 'click',
          // item 图形触发, axis 坐标轴触发, none 不触发
          trigger: 'item',
          // 浮层隐藏的延迟
          hideDelay: 800
        },
        series: [{
          type: 'graph',
          coordinateSystem: 'cartesian2d',
          z: 3,
          label: {
            show: true,
            position: 'bottom',
            color: '#333333',
            //避免显示name名过长
            formatter: function(item) {
              if (item.data.name.indexOf('_') > -1) {
                let arrIndex = item.data.name.indexOf('_') + 1;
                let arr = item.data.name.substring(arrIndex);
                if (arr.length > 20) {
                  return (arr.substring(0, 20)).concat('...') ;
                }
                return arr;
              }
              return item.data.name;
            }
          },
          data: charts.nodes,
        }, {
          type: 'lines',
          polyline: true,
          coordinateSystem: 'cartesian2d',
          silent: true,
          lineStyle: {
            type: 'dashed',
            width: 1,
            color: '#175064',
            curveness: 0.2

          },
          effect: {
            show: true,
            trailLength: 0,
            symbol: 'arrow',
            color: '#2E6BE6',
            symbolSize: 8
          },
          data: charts.linesData
        }]

      };
      this.chartInstance.setOption(initOption);

    },
    // 数组字段去重
    getArrUnique(arr) {
      const res = new Map();
      return arr.filter((item) => !res.has(item.type) && res.set(item.type, 1));
    },
    getListArrUnique(arr) {
      const res = new Map();
      return arr.filter((item) => (!res.has(item) && res.set(item, 1)));
    },
    getListArrUniqueName(arr) {
      const res = new Map();
      return arr.filter((item) => (!res.has(item.name) && res.set(item.name, 1)));
    },
    //数组内重复字段计数
    getRepeatNum(arr) {
      let arrData = arr;
      let obj = {};
      for (let i = 0; i < arrData.length; i++) {
        var item = arrData[i].type;
        obj[item] = (obj[item] + 1) || 1;
      }
      return obj;
    },
    deWeight(arr, ...arguements) {
      function getBoolean(o, m) {
        let list = arguements.map(x => o[x] == m[x]); //值均为布尔
        return list.every(i => i); //要使这些布尔值都真才能满足条件,因为要求的条件是 并且
      }
      let result = [];//新数组
      //总数组与新数组比较,遍历总数组时用新数组的some方法进行判断
      arr.map(o => !result.some(m => getBoolean(o, m)) ? result.push(o) : '');
      return result;
    }
  }
};
</script>

<style lang='scss'>
.graph-container {
  width: 100%;
  height: 100%;
  position: relative;

  .graph-chart {
    width: 100%;
    height: 100%;
  }

  .noData {
    height: 100%;
    padding-top: 18%;
    text-align: center;
    color: #999;
    font-size: 14px;
    position: absolute;
    top: 0;
    left: 0;
    right: 0;
    margin: 0 auto;
  }
}
</style>
总结
关系拓扑图不只是前端构建这块需要掌握技巧,关于传入该组件的数据也需要处理,可参考测试数据内容
echarts的api关于关系拓扑图的属性可以仔细研究,会有不一样的发现
如果觉得有帮助的话,欢迎关注一波文章来源地址https://www.toymoban.com/news/detail-648056.html
到了这里,关于vue项目中实际构建echarts拓扑关系图业务的文章就介绍完了。如果您还想了解更多内容,请在右上角搜索TOY模板网以前的文章或继续浏览下面的相关文章,希望大家以后多多支持TOY模板网!